2021 Review — Performance and Financial Position
2022 started with positive prospects for the Greek economy, which is expected to maintain its strong pace of growth, recovering from a very low level, owing to the prolonged recession followed by the pandemic.
In 2021, Greece could achieve a stronger-than-expected post-Covid economic rebound, exceeding the budgeted GDP growth rate estimate of 6.9%, with the European Commission now forecasting a growth rate of 8.5% for 2021, while for 2022 and 2023 GDP growth has been projected at around 5% and 3.5% respectively, for a cumulative three-year period GDP growth just shy of 18%.
However, the next couple of years could become a turning point for the Greek economy, among others, for two reasons. The first is a possible upgrade of Greece’s sovereign-debt rating to "Investment Grade", for the first time since the financial crisis, which in turn could result in a significant increase in investment flows. The upgrade of Greece’s credit rating, may not take long until it happens, considering that the country is currently two notches short of the investment status.
The second, is the key contribution of the Recovery and Resilience Facility (RRF) to the Greek economy which is expected to exceed the €30bn (>15% of country’s current GDP) over the course of the next few years, in grants and loans with favorable terms, strengthening Greek banks and the Greek economy as a whole. RRF’s contribution, in major infrastructure and energy projects, will be instrumental, as "Green Transition" is one of the Facility’s main pillars.
The prospects of regaining the "Investment Grade" status as well as the inflows expected from the Recovery and Resilience Facility coupled with other EU funding, should offer an extra boost in vital sectors of the Greek economy, with analysts expecting strong post-Covid growth going forward as consumer spending is returning to pre-pandemic levels, while savings accumulation during pandemic could further enhance private spending. In the meantime, Greece is gradually making progress in attracting significant foreign investments.
At a regional and global level, critical issues such as the inflationary pressures stemming mainly from the energy crisis, supply chain disruptions, the evolution of the pandemic as well as today’s geopolitical turbulence, with Ukraine being at the center, are expected to remain in the front line and affect the course of the global economy during 2022.
At the same time, the main central banks are moving more aggressively with interest rate hikes. While ECB remains cautious, the bank is preparing the ground for a potential interest rate increase provided inflation remains high. The knock-on effect on interest rates, on top of the consequential increase in borrowing cost, which could affect a number of under-capitalized companies, could potentially result in portfolio reshuffling and increased volatility in markets that have been historically benefited from loose monetary policies.
MYTILINEOS, following a record-high profitability in 2021, is building momentum having laid the foundation for an even stronger 2022. The company’s proven business model’s resilience coupled with the completion of significant investments as well as its well-capitalized balance sheet, safeguard future profitability from exogenous factors, maintaining in that way MYTILINEOS’ steep growth trajectory in years to come!
Power & Gas Business Unit
2021 was marked (a) by the surge in European natural gas prices, due to the global increase in demand for natural gas, owed to the restart of the economy in the post-Covid era (without a respective increase in offer) coupled with a surge in CO2 prices, which led in a significant increase of the wholesale prices (DAM) and (b) from the growth in domestic electricity demand (+4.6% compared to 2020) due to the extreme summer temperatures.
In this environment, the company’s ability, owed to the size of its portfolio (the company’s natural gas imports represent the 22% of total domestic imports), to source natural gas in competitive prices combined with the high efficiency, availability, reliability and flexibility of its plants (two CCGTs and one CHP), resulted in a total production of 5.08TWh. This production represents 9.7% of total demand in the interconnected system as well as 23.3% of total production from natural gas fired plants. Total production from company’s thermal plants and RES came in at 5.62 TWh, representing a 10.7% of total domestic demand.
The following chart, shows coverage per energy source of total electricity demand (in TWh) for 2021 and 2020:
It is also noted that, in the context of maintaining high efficiency rate, availability, reliability and flexibility of its units, MYTILINEOS proceeded with a successful
Regarding electricity supply, Protergia is consistently growing its presence in retail market, with 334,000 electricity and natural gas meters as at the end of 2021, compared to 285,000 meters in 2020, while its electricity market share reached c.7.07% at the end of 2021
The Company’s RES production capacity reached 210.7 MW. In February, MYTILINEOS sold its minority shares of the ADERES Wind Park of 11.5 MW capacity, while the construction of the new 43.2MW capacity Wind Park, which is expected to come online on the 4th quarter of 2022, is currently under way. In 2021, the Company, in cooperation with EGNATIA IKE, commenced the development of 130MW of Solar PV projects, which will soon enter the construction phase. Additionally, the Company announced the Joint Venture with Copenhagen Infrastructure Partners for the development and construction of offshore wind parks, once the required legal and regulatory framework is in place.
Finally, the construction of the new 826MW Combined Cycle Gas Turbine (CCGT) unit with General Electric’s H-Class gas turbine is proceeding normally and in accordance with the initial timeline. Power plant’s operation is expected during summer 2022, strongly contributing to the country's transition to an energy mix with a significantly lower carbon footprint. The project is executed by the Company’s Sustainable Engineering Solutions Business Unit with important synergies, ensuring reduced investment cost.
Metallurgy Business Unit
The positive aluminium and alumina pricing environment, as it was formed at the end of 2021, has been further enhanced in early 2022, resulting in a sharp increase in prices, particularly those of aluminium and aluminium Premia. Unfulfilled demand due to supply shortages, supply chain disruptions, higher raw materials, energy as well as transportation costs contributed to inflation rise, and thus a commodity price increase. Soaring energy prices in Europe during H1 2021, led to production cuts or even closure of some aluminum smelters. The impact of the reduced European metal supply was depicted in the billet Premia which increased significantly. Although, alumina prices increased on a year-on-year basis, the growth did not follow that of the Aluminum prices.
The H2 2020 upward trend of aluminum prices, maintained throughout 2021, taking the average LME aluminium price to $2,484/t, significantly higher (+44%) than the corresponding period of the previous year ($1,728/t).
Equally important is the high levels of the aluminium Premia in Europe and the billet Premia in particular, which increased by 145% over 2020.
Alumina API index moved higher, with the average 2021 price coming in at $330/t, a c.22% increase over last year.
U.S. dollar moved lower against Euro, reaching €/$ 1.18, a c.4% weakening compared to 2020 (€/$ 1.14).
Global economy recovery fueled raw material, energy (mainly oil and natural gas), transportation cost as well as CO2 price increases, thus pushing both alumina and aluminium production costs up during 2021 by c.35% vs.2020.
The new Metallurgy, competitiveness programme, "HEPHAESTUS" was successfully completed at the end of 2021, resulting in a historic performance in cumulative production of both primary and secondary aluminum as well as the production of hydrated alumina. Alumina and aluminium production levels increased by 5% compared to 2020.
Renewables & Storage Development Business Unit (RSD BU)
Introduction
MYTILINEOS is strategically focused on the continuous improvement of its sustainability performance and committed to the ESG targets which have been set in February 2021 ESG Summit. Under this concept, Renewable & Storage Development Business Unit continues to focus on the timely execution of the existing contracts and the undertaking of new projects and investments on targeted markets with increased green energy needs, through both the construction of projects for third parties, as well as through its own development platform.
Following a slow start in the first half of the year affected from increased costs on main equipment transportation, the RSD BU showed signs of its growth potential, with improved performance, over the previous year, driven mainly by the contribution of Build, Operate & Transfer (BOT) activity.
Capitalising on our significant Solar EPC capabilities, our Renewables and Storage Development Business Unit is implementing a project development platform for Solar PV & Energy Storage projects, aiming to develop, construct and potentially monetise internally developed projects.
Under this platform our Renewables and Storage Development Business Unit is developing projects with a mature aggregate capacity of approximately c. 2.0 GW in Spain, Italy, Cyprus, the United Kingdom, Chile, Australia, Romania, South Korea, Portugal, and the Republic of Ireland. On top of the above, BOT portfolio also includes projects in early-stage of development, with capacity of c.3.0 GW.
The Renewables & Storage Development (RSD) Business Unit, has notably improved its performance compared to 2020, showing its growth prospects. In particular, the RSD BU has recorded €365 million turnover in 2021, compared to €263 million in 2020, which corresponds to 13.7% of company’s total turnover. EBITDA, stood at €22 million, from €15 million in 2020, posting a 41% increase.
| amounts in m. € | FY 2021 | FY 2020 | Δ % |
|---|---|---|---|
| Revenues | 365 | 263 | 38% |
| EBITDA | 22 | 15 | 43% |
| Margins (%) | Δ(bps) | ||
| EBITDA | 6% | 6% | 9 |
Build, Operate & Transfer (BOT) transactions, were major contributors in the aforementioned performance, with two new transactions have been concluded during the year, for the sale of projects with 89MW & 100MW capacity in Romania and Spain respectively.
Other factors contributed towards RSD’s performance, were also the contracting and commencement of construction of a series of projects in South America, Europe and Uzbekistan. In total, 878MW of projects have been contracted in 2021, with the signed backlog currently standing at €260 million, while €91 million of projects are in mature stages of contracting.
Additionally, 2021 has been the first year during which BU’s turnover was enhanced from Solar Plants that came in operation in Australia and Cyprus.
Finally, it should be noted that the backlog for the RSD Business Unit existing projects amounts to € 260 million. The table below shows the expected income for the main projects per country which contribute significantly to the total backlog.
| International Renewables and Storage Development | |||
|---|---|---|---|
| (Amounts in thousands €) | up to 1 year | 1-3 years | Total |
| Greece | 101,531 | 13,905 | 115,436 |
| Cyprus | 52,466 | - | 52,466 |
| Great Britain | 32,638 | - | 32,638 |
| Chile | 32,034 | - | 32,034 |
| Spain | 24,459 | - | 24,459 |
| Uzbekistan | 3,103 | - | 3,103 |
| Total | 246,231 | 13,905 | 260,136 |
Sustainable Engineering Solutions Business Unit (SES BU)
Financial Information
2021 results reflect the profitable course of the Sustainable Engineering Solutions Business Unit (SES BU), certifying its restart, with its strategic focus on projects that promote Energy Transition and Sustainability, after a year significantly affected by the Covid- pandemic. SES BU 2021 turnover came in at €370m compared to €172m in 2020.
The main contributing factors for the above-mentioned performance of SES BU, are:
a. The continuation of the project "Engineering, Procurement and Construction as well as the supply and installation of 4 gas General Electric GT13E2 turbines in an open cycle configuration, as well as all the relevant auxiliary equipment, including a 220 / 66kV substation". The project, for 2021, contributed €115.9m in turnover.
b. The continuation of the project "Construction of regional services, centers and separate spaces in the islands of Samos, Kos and Leros", which during the year recorded turnover of €81.5m.
c. The continuation of the project "Engineering, Procurement and Construction of a Combined Heat and Power Cogeneration Unit (CHP) in Ljubljana, Slovenia" which, for 2021, recorded turnover of €50.9m.
d. The continuation of the project " Engineering, Procurement and Construction (EPC) of the "Protos" Energy Recovery Facility)" in Cheshire, England, with non-recyclable waste capacity of 400ktpa". The project contributed €34.3m of turnover in 2021.
SES BU 2021 EBITDA came in at €33m.
Significant events of 2021
Following the strategy of further development in the field of Transmission & Distribution (T&D), MYTILINEOS and the Independent Power Transmission Operator (IPTO) announced the contracting of Koumoundouros High Voltage Center (HVC) reconstruction project, with a total cost of €45.8m. The project has a duration of 30 months and is expected to be completed in September 2023. It is a "Turn-Key" project regarding the replacement of all switching devices of 150 kV and 400 kV with cutting-edge GIS equipment, the addition of two autotransformers, five compensation self-inductors, the installation of a modern digital protection and control system, as well as the replacement of the HVC’s ancillary services.
MYTILINEOS entered into a contract agreement with Operatori i Sistemit te Transmetimit Sh. a. (OST) for the development and execution of a 400kV network in the Republic of Albania. This is a strategic energy project for Albania that will aid the country to effectively participate in the future in the European energy markets. By developing this 400kV network in the Southern part of Albania, the Project will contribute to the energy transmission system by enhancing the interconnections with the electricity networks of the neighboring countries and will enable conditions for trade exchanges, achieving a secure and reliable energy network system. This is the first energy project for MYTILINEOS in Albania, heralding a new era for the Company in the broad Balkan Region, through its elevated SES BU. The project is scheduled to be completed within 24 months, on top of the 12 months of the warranty period, while the contractual value for MYTILINEOS amounts to €21.1m. The project is co-financed by the Federal Republic of Germany through KfW as well as by the European Union within the Western Balkans Investment Framework.
MYTILINEOS entered into a contract agreement with the Georgian State Electrosystem JSC (GSE) for the execution of two new 220/110kV substations and the extension of 500kV and 400kV switchyards of an existing converter station in Georgia. The scope of the project involves the construction of two new substations 220/110kV in "Lajanuri" and "Ozurgeti" and the extension of 400 kV and 500 kV AC switchyards in Akhaltsikhe converter station. The new substations of Lajanuri and Ozurgeti will include a 220kV and a 110kV switchyard with double bus-bar arrangement and four (4) three-phase 220/110/35kV autotransformers (two for each substation). The works at Akhaltsikhe converter station will include the completion and extension of two existing diameters, diameter 20C01 (at 400kV Switchyard) and diameter 10B04 (at 500kV switchyard). This is the first project for MYTILINEOS in Georgia and in the broader Caucasus Region. The project in Georgia is scheduled to be completed within 30 months, on top of the 24 months of the warranty period and the contractual value for MYTILINEOS amounts to €35.7m.
MYTILINEOS, also signed contracts with NAFSIKA SA. for the modernization of the five starts (5*) hotel unit, "ASTERIA Glyfadas", with 400 beds capacity, along with the supplementary as well as dining and leisure/entertainment areas.
Signed backlog amounts to €755m, while in the table below, there is an analysis of the main projects per country that had a significant contribution in total backlog.
| Sustainable Engineering Solutions | |||||
|---|---|---|---|---|---|
| (Amounts in thousands €) | up to 1 year | 1-3 years | 3-5 years | | Total |
| GREECE | 159,262 | 112,206 | 19,396 | 491 | 291,355 |
| LIBYA | 29,200 | 174,107 | - | - | 203,307 |
| UNITED KINGDOM | 121,349 | 26,479 | - | - | 147,828 |
| GEORGIA | 9,452 | 26,081 | 70 | - | 35,603 |
| ALGERIA | 9,194 | 17,742 | - | - | 26,936 |
| ALBANIA | 17,925 | 3,194 | - | - | 21,119 |
| OTHER | 18,521 | 9,885 | - | - | 28,406 |
| Total | 364,903 | 369,694 | 19,466 | 491 | 754,554 |
* Amounts in thousand €
**The amount of € 420 million concerning the backlog of Deir Azzur project is not included in the above table. For the aforementioned project the Group has already announced the pause of the construction on site.
Total Impact on Group Sales and EBITDA
Specifically, the effect in Group’s turnover, EBITDA and Net Profit during 2021 compared with previous year is presented below:
A. SALES
| Amounts in mil. € | Group Total | Power & Gas Sector | Metallurgy | Renewables and Storage Development | Sustainable Engineering Solutions | Other | Group Total | |
|---|---|---|---|---|---|---|---|---|
| Sales 2020 | 1,898.7 | 927 | 537 | 263 | 171 | - | 1,898.7 | |
| Intrinsic Effect | 301 | Volumes | (40.9) | 32.0 | (8.9) | |||
| Shut-Down income | ||||||||
| SES Contrancts | 1.1 | 104.2 | 203.6 | 308.9 | ||||
| Other | 0.8 | 0.8 | ||||||
| Market Effect | 556 | Organic $/€ eff. | - | (23.1) | (2.8) | (4.2) | (30.0) | |
| Premia & Prices | 382.9 | 211.1 | 594.0 | |||||
| CACs | (8.0) | (8.0) | ||||||
| Other | ||||||||
| Hedging | (91) | (91.5) | (91.5) | |||||
| Sales 2021 | 2,664.1 | 1,260.9 | 667.6 | 364.9 | 370.7 | - | 2,664.1 |
B. EBITDA
| Amounts in mil. € | Group Total | Power & Gas Sector | Metallurgy | Renewables and Storage Development | Sustainable Engineering Solutions | Other | Group Total | |
|---|---|---|---|---|---|---|---|---|
| EBITDA 2020 | 315.1 | 156.8 | 149.3 | 15.1 | (2) | (4) | 315.1 | |
| Intrinsic Effect | 95.7 | Projects | - | 9 | 33.6 | 42.3 | ||
| Settlements | ||||||||
| Volumes | 49.2 | 19.4 | 68.6 | |||||
| Other | (16) | 1.1 | (15) | |||||
| One-off items | (25.9) | LAGIE | (9) | (9) | ||||
| Settlement Natural Gas | (6) | (8) | (14) | |||||
| Other | (3) | - | (4) | |||||
| Market Effect | 39.6 | Aluminium | 165.7 | 165.7 | ||||
| Alumina | 26.7 | 26.7 | ||||||
| €/$ rate effect | (16) | - | 1.9 | (14) | ||||
| Natural Gas Price Effect | (229) | (62) | (292) | |||||
| CO2 | (34) | (42) | (76) | |||||
| RTBM/Day Ahead Market | 298,6 | 298.6 | ||||||
| Net Energy Cost | (70) | (70) | ||||||
| Other | ||||||||
| Hedging | (65.9) | (63.5) | (2.4) | (65.9) | ||||
| EBITDA 2021 | 358.5 | 147.0 | 159.3 | 21.6 | 33.5 | -3.0 | 358.5 |
C. Net Profit after minorities
| Amounts in mil. € | Power & Gas Sector | Metallurgy | Renewables and Storage Development | Sustainable Engineering Solutions | Other | Group Total |
|---|---|---|---|---|---|---|
| Net Profit after Minorities 2020 | 128.8 | |||||
| Effect from: | ||||||
| Earnings before interest and income tax (EBIT) | (2.3) | 24.5 | 6.5 | 24.4 | 0.7 | 53.8 |
| Net financial results | (5.0) | |||||
| Minorities | (4.4) | |||||
| Discontinued Operations | 1.0 | |||||
| Income tax expense | (12.1) | |||||
| Net Profit after Minorities 2021 | 162.1 | |||||
D. Sales and Earnings before interest, taxes, depreciation, and amortization per Business Unit Sales & EBITDA
| (Amounts in thousands €) | Power & Gas | |||||
|---|---|---|---|---|---|---|
| Sales | Energy Supply | Energy Production | Natural Gas Supply | RES | Intrasegment Eliminations | Total |
| 31/12/2021 | 837,875 | 595,492 | 156,887 | 53,127 | (382,496) | 1,260,885 |
| 31/12/2020 | 439,736 | 272,371 | 163,791 | 51,066 | - | 926,964 |
| EBITDA | ||||||
| 31/12/2021 | (60,506) | 155,419 | 12,532 | 39,594 | — | 147,039 |
| 31/12/2020 | (3,927) | 114,458 | 7,030 | 39,204 | — | 156,764 |
| (Amounts in thousands €) | Metallurgy | |||
|---|---|---|---|---|
| Sales | Alumina | Aluminium | Metalwork / Other | Total |
| 31/12/2021 | 140,165 | 488,753 | 38,674 | 667,592 |
| 31/12/2020 | 117,534 | 379,218 | 39,939 | 536,690 |
| EBITDA | ||||
| 31/12/2021 | 26,482 | 119,426 | 13,416 | 159,325 |
| 31/12/2020 | 45,321 | 86,038 | 17,862 | 149,221 |
| (Amounts in thousands €) | Renewables and Storage Development | |
|---|---|---|
| Sales | Total | |
| 31/12/2021 | 364,903 | 364,903 |
| 31/12/2020 | 263,491 | 263,491 |
| EBITDA | ||
| 31/12/2021 | 21,634 | 21,634 |
| 31/12/2020 | 15,122 | 15,122 |
| (Amounts in thousands €) | Sustainable Engineering Solutions | ||||
|---|---|---|---|---|---|
| Sales | Conventional Business | Infrastructure | New Energy Solutions | New Enviromental Solutions | Total |
| 31/12/2021 | 181,804 | 141,032 | 11,971 | 35,863 | 370,670 |
| 31/12/2020 | 137,126 | 28,335 | 4,413 | 1,604 | 171,478 |
| EBITDA | |||||
| 31/12/2021 | 14,258 | 16,615 | 1,096 | 1,525 | 33,495 |
| 31/12/2020 | (3,602) | 248 | 977 | 149 | (2,227) |
| (Amounts in thousands €) | Other | Total |
|---|---|---|
| Sales | ||
| 31/12/2021 | - | — |
| 31/12/2020 | - | — |
| EBITDA | ||
| 31/12/2021 | (2,985) | (2,985) |
| 31/12/2020 | (3,887) | (3,887) |
*The Companies which are consolidated with equity method and own Renewable Energy Units with capacity of 16.7MW are not included in the amounts of RES.
The Group’s policy is to monitor its performance on a month to month basis thus tracking on time and effectively the deviations from its goals and undertaking necessary actions. The group evaluates its financial performance using the following generally accepted Key Performance Indicators (KPI’s):
- EBITDA (Operating Earnings Before Interest, Taxes, Depreciation & Amortization): The Group defines the "Group EBITDA" quantity as profits/losses before tax, itemized for financial and investment results; for total depreciation (of tangible and intangible fixed assets) as well as for the influence of specific factors, i.e. shares in the operational results of associates where these are engaged in business in any of the business sectors of the Group, as well as the influence of write-offs made in transactions with the aforementioned mentioned associates.
- ROCE (Return on Capital Employed): This index is derived by dividing profit before interest, taxes, depreciation & amortization, to the total capital employed by the Group, these being the sum of the Net Position; Total Debt; and Long — term forecasts.
- ROE (Return on Equity): This index is derived by dividing profit after tax by the Group's Net Position.
- EVA (Economic Value Added): This metric is derived by multiplying the total capital employed with the difference (ROCE — Capital Expenditure) and constitutes the amount by which the financial value if the company increases. To calculate the capital expenditure, the Group uses the WACC formula — " Weighted Cost of Capital".
The Weighted average cost of capital is calculated as, the quotient of Equity Capital to Total Capital Employed (Equity Capital and Debt) multiplied by the return
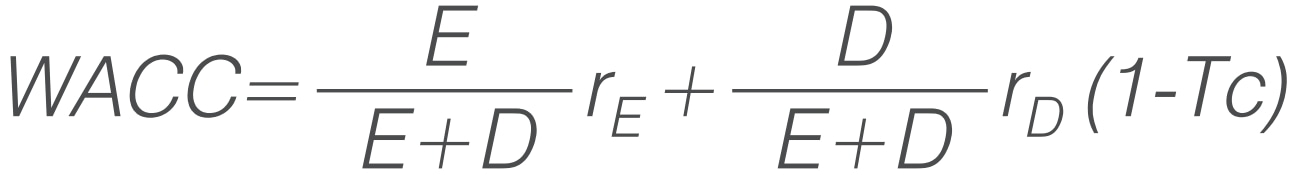
Where
E Equity Capital
D Debt
rE Return on equity
rD Return on debt
Tc Tax rate
The calculation of the indicator Weighted Average Cost of Capital (WACC) for the 2021 sums to 3.80% and is based on the countries in which the Group operates.
The above indicators for 2021 compared with 2020 are as follows:
EBITDA & EVA in thousands €
| 2021 | 2020 | |
|---|---|---|
| EBITDA | 358,508 | 314,993 |
| ROCE | 10.5% | 8.8% |
| ROE | 10.5% | 8.5% |
| EVA | 203,422 | 71,050 |